Now that the two viewpoints of games as good and bad influences have been established, its time to establish the statistics.
US Population and Crime Statistics
*Numbers are in millions


US population and Crime Statistics Explained
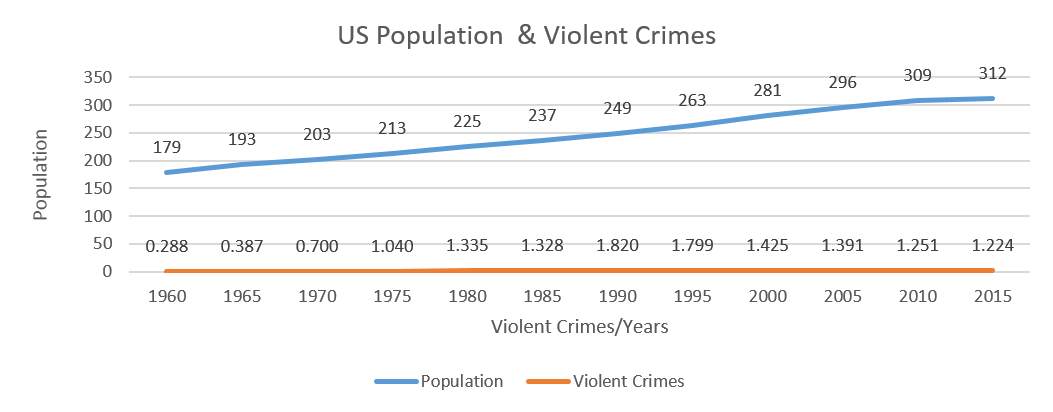
•The graph shows information from 1960 – 2015
•The population line (blue) shows a steady increase in population growth.
•The violent crime line (orange) remains constant over the 55 year span.
•The graph shows that although the population increased over the years, violent crime remained constant. Therefore, there is no relationship between the increase in population and violent crimes.
US Population and Crime Statistics Rate of Change
US Population and Crime Rates of Change Explained
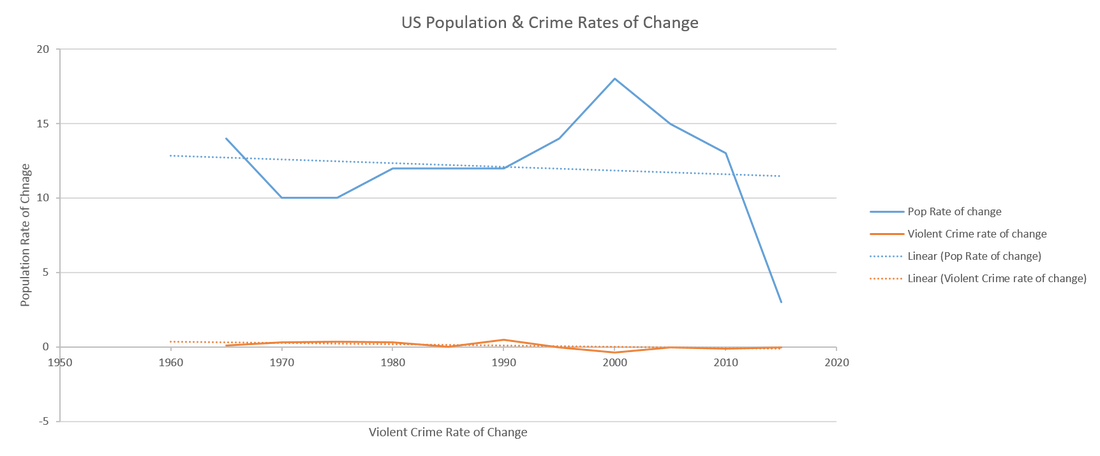
•The population rate of change shows a slight decrease in the first 5 years, remained flat for the next 5 years, increased steadily between 1975 and 2000 after which there was a sharp decrease.
•The violent crime rate of change has remained constant over the years with a slight increase in 1990 and a slight decrease in 2000
•In the year 2000 when the population peaked at an 18% increase, violent crime rate was at its lowest and was reduced to -.374%
•The violent crime rate of change has remained constant over the years with a slight increase in 1990 and a slight decrease in 2000
•In the year 2000 when the population peaked at an 18% increase, violent crime rate was at its lowest and was reduced to -.374%
Overall Crime Trends
Overall Crime Trends Explained
•This chart runs from 1973-2009
•The chart shows that the overall U.S. crime rate increases from 1973.
•In the 1990's, the overall crime rate began to steadily decrease until 2009
•The chart shows that the overall U.S. crime rate increases from 1973.
•In the 1990's, the overall crime rate began to steadily decrease until 2009
US Video Game Market Revenue
US Video Game Market Revenue Explained
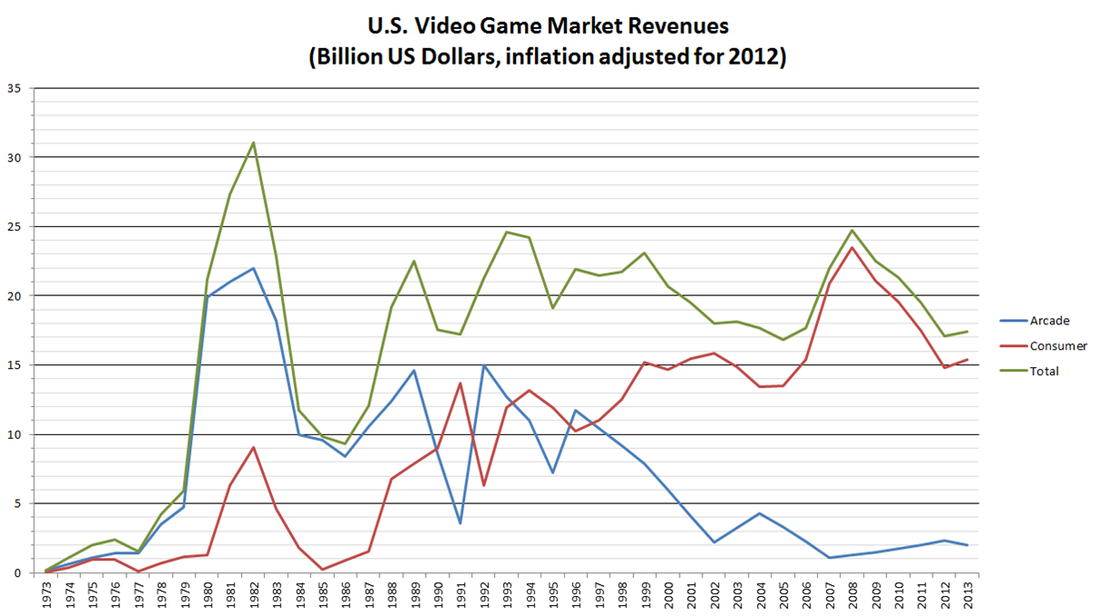
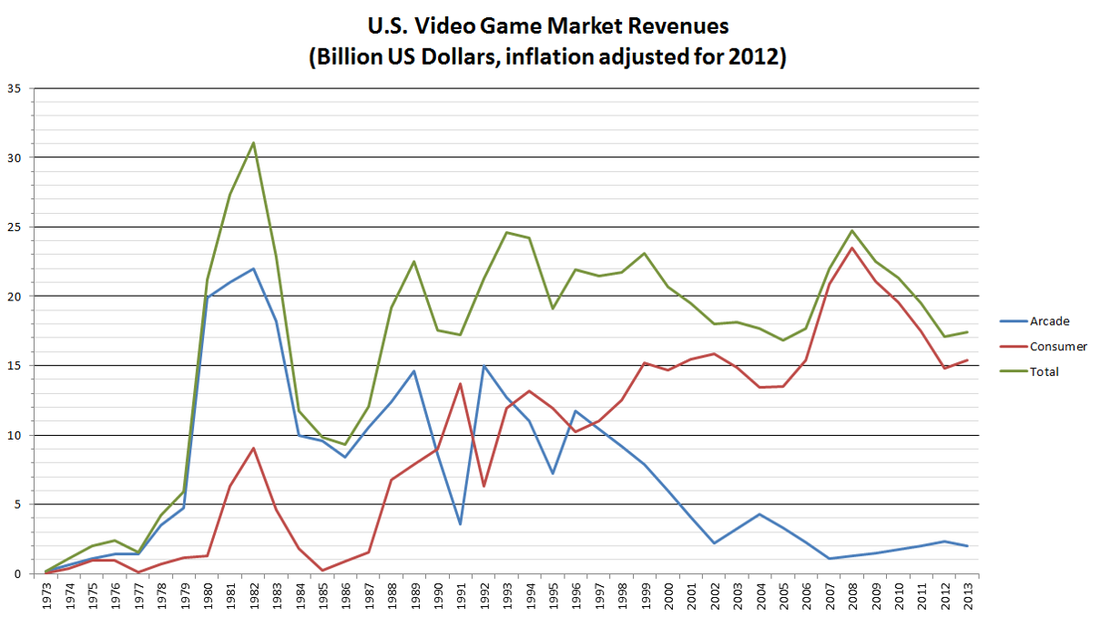
•The graph shows video game revenues from 1973 to 2013
•From 1973 to 1976, the total video game revenue increased; then fell a year later in 1977. Between 1978 and 1981 revenue dramatically increased to $31 billion, but drastically declined from 1982 to 1986 to only $9 billion. Between 1986 and 1989 total revenues bounced back to $22 billion, only to fall again in 1991. From there, the total revenues increased and decreased until 2013.
•1981 shows the climax for the video game revenue between 1973 and 2013
•1977 shows the lowest point of the graph where revenue declined to $2 billion.
Connecting the Graphs
•The graph showing the total video game revenue peaked in 1981 at $31 billion and population rate increased by 12% and at that same time the violent crime rate only increased by 1.335%
•In 1990 the violent crime rate had its highest increase of 1.820% when the population rate of change remained at 12% and the video game revenue dropped to only $17 billion; a 54.84% decrease from its peak in 1981
• In 2000 the population rate of change had its largest increase of 18% and the largest decrease in violent crime rate for that same period. It also showed video game revenue at $20 billion; a slight increase since 1990
•According to the information gathered there is no correlation between video games and violent crimes based on the facts presented above. When video game sales peaked there was no apparent aggression to commit violent crimes.
